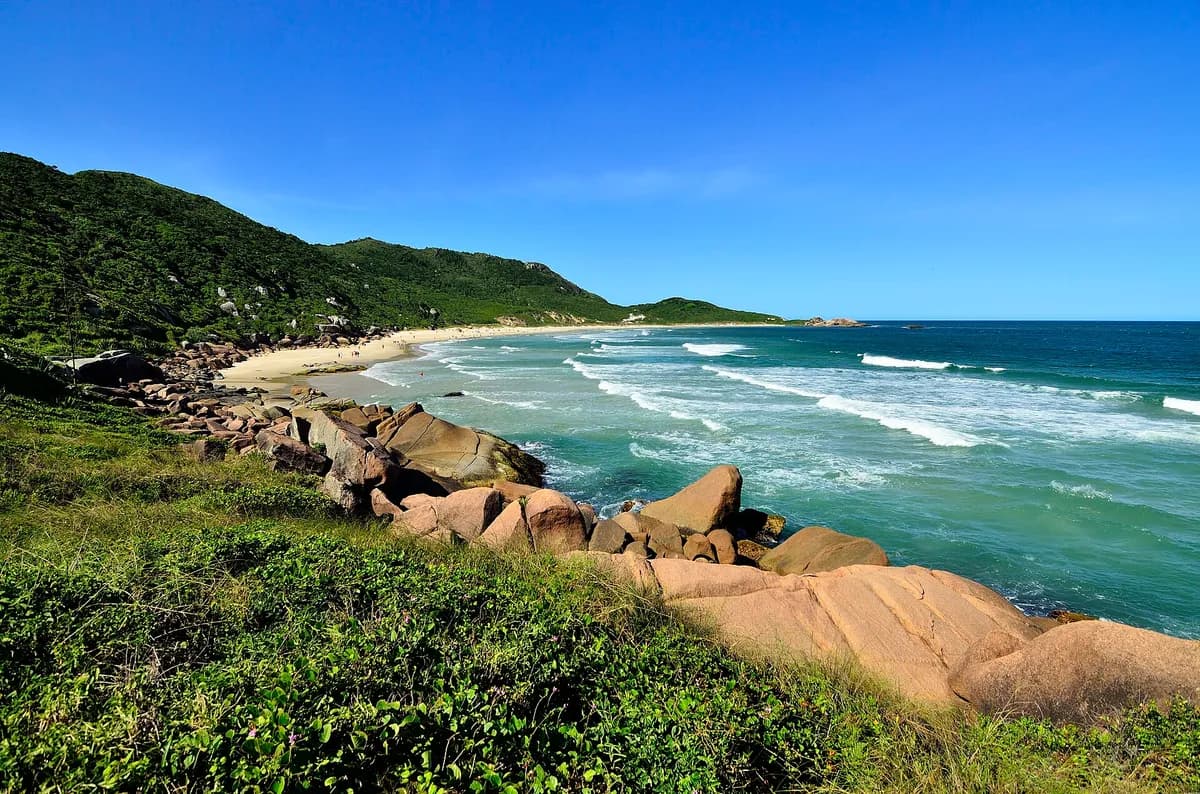
The empty beach immediately north of Praia Mole, and the island's clearest example of a wave protected by its own access. There is no road: you walk over the headland from Mole, which is enough to keep the peaks uncrowded on days when Mole is shoulder-to-shoulder a few hundred metres away. The wave is punchy and short, working on E/NE swell with W/NW offshores. Galheta is also an officially recognised naturist beach — worth knowing before you arrive rather than after.
This is the week's best-rated wave quality, not a suitability call. Take the 2-minute quiz to see how Praia da Galheta fits your level.
Surf outlook
Today’s call (our estimate? (what does this mean?)A 1-5 score of how organised the waves look, from forecast height, period and wind speed — it rates the waves, not whether they fit your ability.)
1/5Flat or junky
Sunrise around 05:27, sunset around 18:27 today.
Mon’s call (our estimate? (what does this mean?)A 1-5 score of how organised the waves look, from forecast height, period and wind speed — it rates the waves, not whether they fit your ability.)
1/5Flat or junky
Sunrise around 05:27, sunset around 18:28 on Mon.
Tue’s call (our estimate? (what does this mean?)A 1-5 score of how organised the waves look, from forecast height, period and wind speed — it rates the waves, not whether they fit your ability.)
2/5Barely worth it
Sunrise around 05:26, sunset around 18:28 on Tue.
Wed’s call (our estimate? (what does this mean?)A 1-5 score of how organised the waves look, from forecast height, period and wind speed — it rates the waves, not whether they fit your ability.)
2/5Barely worth it
Sunrise around 05:25, sunset around 18:29 on Wed.
Thu’s call (our estimate? (what does this mean?)A 1-5 score of how organised the waves look, from forecast height, period and wind speed — it rates the waves, not whether they fit your ability.)
2/5Barely worth it
Sunrise around 05:24, sunset around 18:30 on Thu.
Fri’s call (our estimate? (what does this mean?)A 1-5 score of how organised the waves look, from forecast height, period and wind speed — it rates the waves, not whether they fit your ability.)
3/5Worth a paddle
Sunrise around 05:23, sunset around 18:30 on Fri.
Sat’s call (our estimate? (what does this mean?)A 1-5 score of how organised the waves look, from forecast height, period and wind speed — it rates the waves, not whether they fit your ability.)
2/5Barely worth it
Sunrise around 05:22, sunset around 18:31 on Sat.
Tide todayHigh around 00:00 (+0.5m)Low around 07:00 (-0.2m)High around 13:00 (+0.6m)Low around 19:00 (-0.0m)
Model estimate (MeteoFrance SMOC), heights relative to mean sea level? (what does this mean?)The long-run average height of the sea surface — tide heights are metres above (+) or below (−) that average., times approximate — not a tide table and not for navigation.
Tide MonHigh around 01:00 (+0.7m)Low around 08:00 (-0.2m)High around 13:00 (+0.4m)Low around 20:00 (-0.2m)
Model estimate (MeteoFrance SMOC), heights relative to mean sea level? (what does this mean?)The long-run average height of the sea surface — tide heights are metres above (+) or below (−) that average., times approximate — not a tide table and not for navigation.
Tide TueHigh around 02:00 (+0.5m)Low around 09:00 (-0.2m)High around 13:00 (+0.2m)Low around 20:00 (-0.3m)
Model estimate (MeteoFrance SMOC), heights relative to mean sea level? (what does this mean?)The long-run average height of the sea surface — tide heights are metres above (+) or below (−) that average., times approximate — not a tide table and not for navigation.
Tide WedHigh around 02:00 (+0.3m)Low around 09:00 (-0.2m)High around 14:00 (+0.1m)Low around 21:00 (-0.4m)
Model estimate (MeteoFrance SMOC), heights relative to mean sea level? (what does this mean?)The long-run average height of the sea surface — tide heights are metres above (+) or below (−) that average., times approximate — not a tide table and not for navigation.
Tide ThuHigh around 03:00 (+0.2m)Low around 10:00 (-0.1m)High around 14:00 (+0.1m)Low around 21:00 (-0.3m)
Model estimate (MeteoFrance SMOC), heights relative to mean sea level? (what does this mean?)The long-run average height of the sea surface — tide heights are metres above (+) or below (−) that average., times approximate — not a tide table and not for navigation.
Tide FriHigh around 04:00 (+0.2m)Low around 06:00 (+0.2m)High around 08:00 (+0.2m)Low around 13:00 (+0.1m)High around 15:00 (+0.1m)Low around 23:00 (-0.2m)
Model estimate (MeteoFrance SMOC), heights relative to mean sea level? (what does this mean?)The long-run average height of the sea surface — tide heights are metres above (+) or below (−) that average., times approximate — not a tide table and not for navigation.
Tide SatHigh around 10:00 (+0.3m)
Model estimate (MeteoFrance SMOC), heights relative to mean sea level? (what does this mean?)The long-run average height of the sea surface — tide heights are metres above (+) or below (−) that average., times approximate — not a tide table and not for navigation.
Times on this card are local to Praia da Galheta. The star call is our own estimate, calculated from the forecast height, period and wind speed — not measured, and not a suitability or safety assessment. How we rate explains the scale. Weather data by Open-Meteo.com, licensed CC BY 4.0. Fetched .
Live conditions
Wave
1.4m
from S
Period? (what does this mean?)Time between waves. Longer period = more powerful, better-organised waves.
5.8s
Swell? (what does this mean?)Waves made by distant storms, smoother and more ordered than the choppy waves a local wind whips up.
1.1m
7s from S
Wind? (what does this mean?)Offshore wind (land to sea) holds waves up and smooths their faces; onshore wind (sea to land) makes them crumble and close out sooner.
26km/h
from S
Estimated wave energy? (what does this mean?)How much power each metre of wave front carries (kW/m), worked out from height and period — higher numbers mean waves that push harder.~6 kW/m(Small)
Calculated by us from the height and period above, not measured — and it describes the swell offshore, not the wave at the break.
Waves from DWD Global WAM, wind from ECMWF IFS, for a model grid point 13 km from the break. Fetched . Times on this card are local to Praia da Galheta. Weather data by Open-Meteo.com, licensed CC BY 4.0. Not a suitability or safety assessment — check local conditions and ask your instructor.
Surf Snapshot
Estimated seasonal guidance — not a live forecast.
Oct
Consistency this monthEstimated
Moderate
Beginner safety
Use caution
Crowd
Moderate
Water quality
Pristine
Typical size: Waist-to-double overhead (2-7 ft)
Recommended boardsFishShortboardMid
Year-round consistency
Oct: Moderate consistencyTap a month
When to surf Praia da Galheta, month by month
Estimated from our authored seasonality — not a live forecast.
Peak season: Feb, Mar, Apr, May, Jun, July, Aug, Sept (High).
Month-by-month surf consistency for Praia da Galheta
Month
Surf consistency
Jan
Moderate
Febpeak
High
Marpeak
High
Aprpeak
High
Maypeak
High
Junpeak
High
Julypeak
High
Augpeak
High
Septpeak
High
Oct
Moderate
Nov
Moderate
Dec
Moderate
Does this wave fit your level?
Rated for Levels 3-6 · Best at Level 5.
Take the 2-minute quiz to see if Praia da Galheta fits you today.
Not a teaching beach, and the reason is access rather than the wave: there are no lifeguards, no facilities and no quick way out other than the walk you came in on. The shorebreak is punchy and the rips are real. Come here as an improver who is already comfortable in a beach break, and preferably not alone.
Hazards
no road access — a headland walk from Praia Mole
no lifeguard cover
punchy shorebreak
rip currents
Nearby spots
The closest graded spots to Praia da Galheta, straight-line distance.