

SpotsWhere to surfCampsTrip planner
Log a session
Surf Scout

Where’s the best place to surf? Skill-graded, honestly reviewed, globally indexed.

Explore
  • Camps & map
  • Best-of guides
  • Where to surf
  • Trip planner
  • Surf & work remotely
  • Surfboard airline fees
  • Board Check
  • Flying with a surfboard
  • Surf Fit Score quiz
Regions
  • Portugal
  • Morocco
  • Bali
  • Costa Rica
  • Sri Lanka
About
  • About
  • Trust & reviews policy
  • How we rate
  • Privacy
  • Analytics choice
  • Terms
  • Photo credits
  • Send feedback
© 2026 Surf Scout. Prototype build.We earn no commission on any link on this site.

Reef break · left,right

Mirissa

South Coast, Sri Lanka

Skill: Levels 2-5
Typical size: 2–6 ft
SpotsWhere to surfCampsTrip plannerBoard CheckQuiz
Surfed here? Log a surf
  1. Map
  2. ›
  3. Sri Lanka
  4. ›
  5. Mirissa

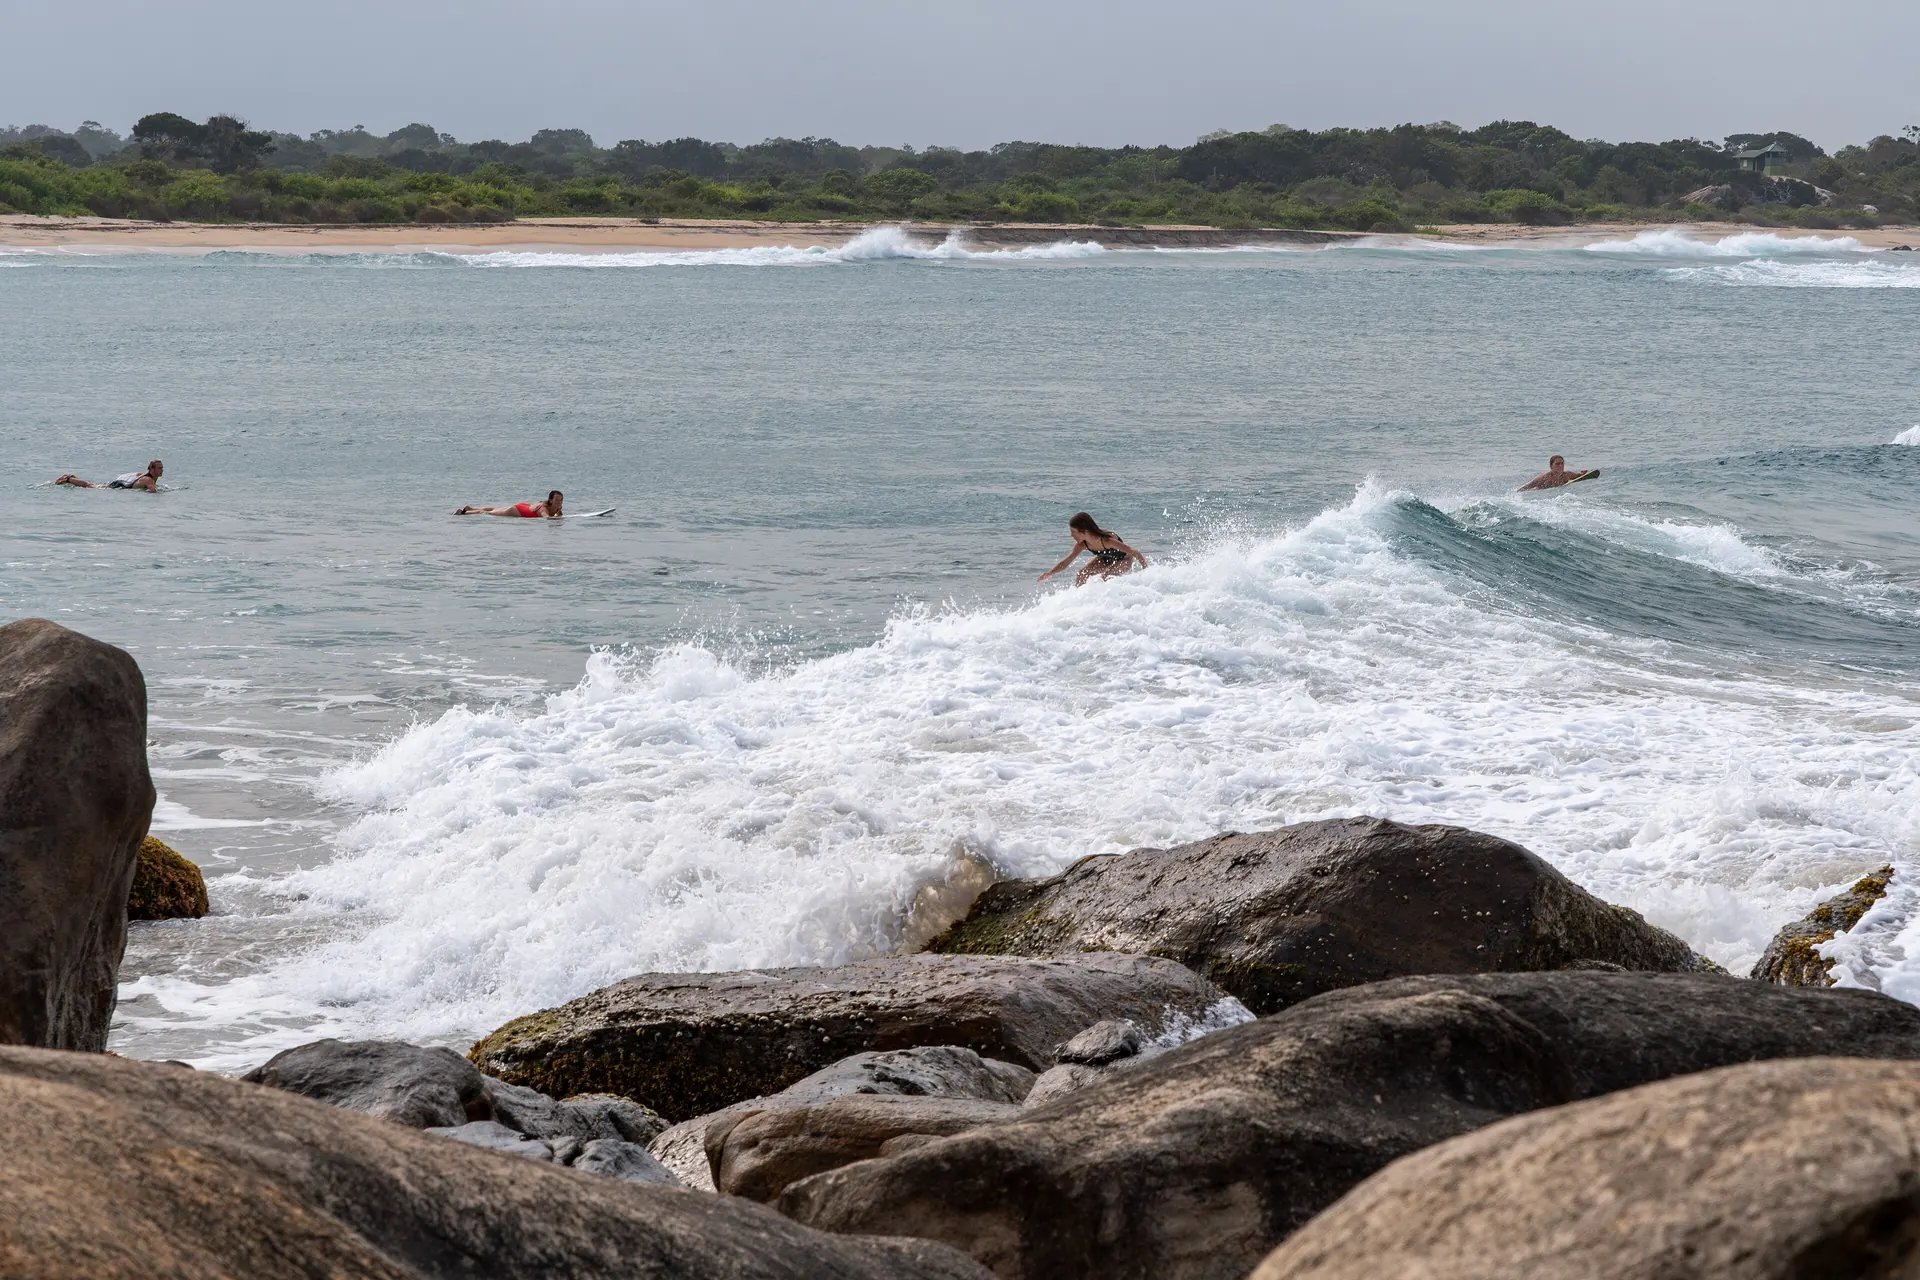
A crescent bay by the fishing harbour with a reef right near the rocks and a softer left closer to the harbour wall — a relaxed stop between Weligama and Hiriketiya.

Plan a trip here →

Advanced details

The granular read for surfers who want it.

Wave type
Reef break
Bottom
reef
Direction
left,right
Best swell
S,SW
Best wind
NW
Best tide
low-mid
Paddle
2/5
Localism
1/5
Water quality
3/5

Surf report

Live
2/5

Barely worth it

3 of 3 lined up. Swell, wind and tide suit Mirissa right now.

Next fair window: 20 Nov 2026, 16:30

Live conditions

21:30 (local)
Wave
1.8m
from SW
Period? (what does this mean?)Time between waves. Longer period = more powerful, better-organised waves.
8.7s
Swell? (what does this mean?)Waves made by distant storms, smoother and more ordered than the choppy waves a local wind whips up.
1.6m
10s from SSW
Wind? (what does this mean?)Offshore wind (land to sea) holds waves up and smooths their faces; onshore wind (sea to land) makes them crumble and close out sooner.
9km/h
from NW
Estimated wave energy? (what does this mean?)How much power each metre of wave front carries (kW/m), worked out from height and period — higher numbers mean waves that push harder.
~14 kW/m(Moderate)

Calculated by us from the height and period above, not measured — and it describes the swell offshore, not the wave at the break.

Waves from DWD Global WAM, wind from ECMWF IFS, for a model grid point 23 km from the break. Fetched 16 Nov 2026, 20:30. Times on this card are local to Mirissa. Weather data by Open-Meteo.com, licensed CC BY 4.0. Not a suitability or safety assessment — check local conditions and ask your instructor.

weak period.

Why
✓
Swell
best: S,SW
✓
Wind? (what does this mean?)Wind blowing roughly along the coastline rather than from the land or the sea. Less help and less harm than a head-on offshore or onshore wind.
best: NW
✓
Tide? (what does this mean?)Where the sea sits in that day's own rise and fall — low, mid or high for THIS spot and THIS day, not a fixed height everywhere shares.
best: low-mid

Next 7 days

The best-rated window in the cached forecast.

Best day this week · Thursday (19 Nov)
3/5Worth a paddle
1.1–1.1m9s period swell from S6km/h windfrom SW

This is the week's best-rated wave quality, not a suitability call. Take the 2-minute quiz to see how Mirissa fits your level.

Surf outlook

Tue’s call (
our estimate? (what does this mean?)A 1-5 score of how organised the waves look, from forecast height, period and wind speed — it rates the waves, not whether they fit your ability.
)
2/5Barely worth it

Sunrise around 05:57, sunset around 17:48 on Tue.

Wed’s call (
our estimate? (what does this mean?)A 1-5 score of how organised the waves look, from forecast height, period and wind speed — it rates the waves, not whether they fit your ability.
)
2/5Barely worth it

Sunrise around 05:58, sunset around 17:48 on Wed.

Thu’s call (
our estimate? (what does this mean?)A 1-5 score of how organised the waves look, from forecast height, period and wind speed — it rates the waves, not whether they fit your ability.
)
3/5Worth a paddle

Sunrise around 05:58, sunset around 17:48 on Thu.

Fri’s call (
our estimate? (what does this mean?)A 1-5 score of how organised the waves look, from forecast height, period and wind speed — it rates the waves, not whether they fit your ability.
)
3/5Worth a paddle

Sunrise around 05:58, sunset around 17:48 on Fri.

Sat’s call (
our estimate? (what does this mean?)A 1-5 score of how organised the waves look, from forecast height, period and wind speed — it rates the waves, not whether they fit your ability.
)
3/5Worth a paddle

Sunrise around 05:59, sunset around 17:48 on Sat.

Sun’s call (
our estimate? (what does this mean?)A 1-5 score of how organised the waves look, from forecast height, period and wind speed — it rates the waves, not whether they fit your ability.
)
3/5Worth a paddle

Sunrise around 05:59, sunset around 17:49 on Sun.

Mon’s call (
our estimate? (what does this mean?)A 1-5 score of how organised the waves look, from forecast height, period and wind speed — it rates the waves, not whether they fit your ability.
)
2/5Barely worth it

Sunrise around 05:59, sunset around 17:49 on Mon.

Tide TueHigh around 04:30 (+0.6m)Low around 11:30 (+0.4m)High around 17:30 (+0.5m)Low around 23:30 (+0.5m)
High 04:30+0.6mLow 11:30+0.4mHigh 17:30+0.5mLow 23:30+0.5m
Model estimate (MeteoFrance SMOC), heights relative to
mean sea level? (what does this mean?)The long-run average height of the sea surface — tide heights are metres above (+) or below (−) that average.
, times approximate — not a tide table and not for navigation.
Tide WedHigh around 04:30 (+0.5m)Low around 12:30 (+0.4m)High around 21:30 (+0.5m)
High 04:30+0.5mLow 12:30+0.4mHigh 21:30+0.5m
Model estimate (MeteoFrance SMOC), heights relative to
mean sea level? (what does this mean?)The long-run average height of the sea surface — tide heights are metres above (+) or below (−) that average.
, times approximate — not a tide table and not for navigation.
Tide ThuLow around 03:30 (+0.5m)High around 09:30 (+0.5m)Low around 15:30 (+0.4m)High around 22:30 (+0.6m)
Low 03:30+0.5mHigh 09:30+0.5mLow 15:30+0.4mHigh 22:30+0.6m
Model estimate (MeteoFrance SMOC), heights relative to
mean sea level? (what does this mean?)The long-run average height of the sea surface — tide heights are metres above (+) or below (−) that average.
, times approximate — not a tide table and not for navigation.
Tide FriLow around 05:30 (+0.5m)High around 10:30 (+0.6m)Low around 16:30 (+0.4m)High around 23:30 (+0.7m)
Low 05:30+0.5mHigh 10:30+0.6mLow 16:30+0.4mHigh 23:30+0.7m
Model estimate (MeteoFrance SMOC), heights relative to
mean sea level? (what does this mean?)The long-run average height of the sea surface — tide heights are metres above (+) or below (−) that average.
, times approximate — not a tide table and not for navigation.
Tide SatLow around 06:30 (+0.4m)High around 11:30 (+0.6m)Low around 17:30 (+0.4m)
Low 06:30+0.4mHigh 11:30+0.6mLow 17:30+0.4m
Model estimate (MeteoFrance SMOC), heights relative to
mean sea level? (what does this mean?)The long-run average height of the sea surface — tide heights are metres above (+) or below (−) that average.
, times approximate — not a tide table and not for navigation.
Tide SunHigh around 00:30 (+0.8m)Low around 06:30 (+0.4m)High around 12:30 (+0.7m)Low around 18:30 (+0.3m)
High 00:30+0.8mLow 06:30+0.4mHigh 12:30+0.7mLow 18:30+0.3m
Model estimate (MeteoFrance SMOC), heights relative to
mean sea level? (what does this mean?)The long-run average height of the sea surface — tide heights are metres above (+) or below (−) that average.
, times approximate — not a tide table and not for navigation.
Tide MonHigh around 00:30 (+0.8m)
High 00:30+0.8m
Model estimate (MeteoFrance SMOC), heights relative to
mean sea level? (what does this mean?)The long-run average height of the sea surface — tide heights are metres above (+) or below (−) that average.
, times approximate — not a tide table and not for navigation.

Times on this card are local to Mirissa. The star call is our own estimate, calculated from the forecast height, period and wind speed — not measured, and not a suitability or safety assessment. How we rate explains the scale. Weather data by Open-Meteo.com, licensed CC BY 4.0. Fetched 16 Nov 2026, 20:30.

Surf Snapshot

Estimated seasonal guidance — not a live forecast.

Nov
Consistency this monthEstimated
High
Beginner safety
Manageable
Crowd
Crowded
Water quality
Good
Typical size: Waist-to-overhead (2-6 ft)Boardshorts
Recommended boardsShortboardFishLongboard
Year-round consistency
Nov: High consistencyTap a month

Quick answers about Mirissa

Where is Mirissa?

Mirissa is in South Coast, Sri Lanka.

What level is Mirissa for?

Mirissa suits Levels 2-5 surfers.

When is surf most consistent at Mirissa?

Our seasonality estimates put Mirissa's most consistent surf in Dec–Feb. This is seasonal guidance, not a live forecast.

  • Peak consistency rating: All-time (on our 0-5 scale).

When to surf Mirissa, month by month

Estimated from our authored seasonality — not a live forecast.

Peak season: Jan, Feb, Dec (All-time).

Month-by-month surf consistency and wetsuit guidance for Mirissa
MonthSurf consistencyWetsuit
JanpeakAll-timeBoardshorts
FebpeakAll-timeBoardshorts
MarHighBoardshorts
AprHighBoardshorts
MayInconsistentBoardshorts
JunRareBoardshorts
JulyRareBoardshorts
AugRareBoardshorts
SeptRareBoardshorts
OctInconsistentBoardshorts
NovHighBoardshorts
DecpeakAll-timeBoardshorts

Does this wave fit your level?

Rated for Levels 2-5 · Best at Level 4.

Take the 2-minute quiz to see if Mirissa fits you today.

Find my Level →

Beginner notes

The left is the easier option; stay well clear of the harbour rocks and exposed reef on the right at low tide.

Hazards

  • sea urchins and exposed rock on the inside
  • crowd when it is working

Nearby spots

The closest graded spots to Mirissa, straight-line distance.

  • Weligama Bay~4 km · Levels 1-4
  • Midigama~8 km · Levels 3-6
  • Ahangama~11 km · Levels 3-5
  • The Rock, Kabalana~13 km · Levels 4-6
  • Unawatuna~24 km · Levels 3-5

Best months to surf here

In-season months for Sri Lanka, from our editors’ season calendar.

  • Jan
  • Feb
  • Mar
  • Apr
  • Nov
  • Dec

On the map