
SpotsWhere to surfCampsTrip planner
Surf Scout

Where’s the best place to surf? Skill-graded, honestly reviewed, globally indexed.

Explore
  • Camps & map
  • Best-of guides
  • Where to surf
  • Trip planner
  • Surf & work remotely
  • Surfboard airline fees
  • Board Check
  • Flying with a surfboard
  • Surf Fit Score quiz
Regions
  • Portugal
  • Morocco
  • Bali
  • Costa Rica
  • Sri Lanka
About
  • About
  • Trust & reviews policy
  • How we rate
  • Privacy
  • Analytics choice
  • Terms
  • Send feedback
© 2026 Surf Scout. Prototype build.We earn no commission on any link on this site.
  1. Map
  2. ›
  3. Peru
  4. ›
  5. Punta Rocas
Reef break
Punta Rocas

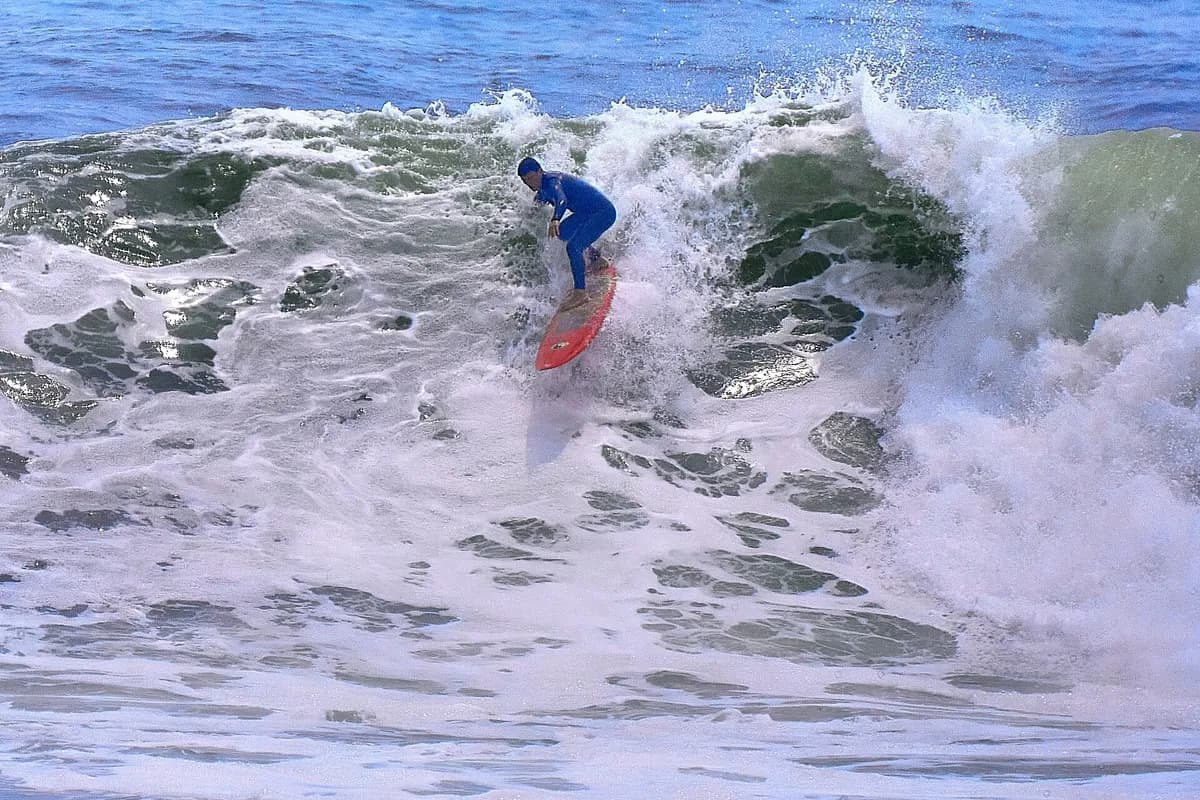
Photo: Olas latinas · CC BY-SA 4.0 · via Wikimedia Commons

Punta Rocas

Punta Rocas, Lima, Peru-12.350° -76.810°
Levels 4-7Typical size: 3–15 ft

The serious end of the Lima beaches and a long-standing contest venue — an exposed reef that its forecast guide calls 'usually a safe bet', which in this context means reliable rather than gentle. It is the wave the Punta Hermosa camps drive to, twenty minutes up the coast, on the same April-to-October south swell that lights up Chicama.

Surfed here? Log a surf in your private logbook

Advanced details

The granular read for surfers who want it.

Wave type
Reef break
Bottom
reef
Best wind
E
Paddle
4/5
Localism
2/5
Water quality
3/5

Next 7 days

The best-rated window in the cached forecast.

Best day this week · Today (25 Oct)
3/5Worth a paddle
1.4–1.4m9s period swell from SSW11km/h windfrom SW

This is the week's best-rated wave quality, not a suitability call. Take the 2-minute quiz to see how Punta Rocas fits your level.

Surf outlook

Today’s call (
our estimate? (what does this mean?)A 1-5 score of how organised the waves look, from forecast height, period and wind speed — it rates the waves, not whether they fit your ability.
)
3/5Worth a paddle

Sunrise around 05:36, sunset around 18:05 today.

Mon’s call (
our estimate? (what does this mean?)A 1-5 score of how organised the waves look, from forecast height, period and wind speed — it rates the waves, not whether they fit your ability.
)
3/5Worth a paddle

Sunrise around 05:36, sunset around 18:05 on Mon.

Tue’s call (
our estimate? (what does this mean?)A 1-5 score of how organised the waves look, from forecast height, period and wind speed — it rates the waves, not whether they fit your ability.
)
3/5Worth a paddle

Sunrise around 05:36, sunset around 18:06 on Tue.

Wed’s call (
our estimate? (what does this mean?)A 1-5 score of how organised the waves look, from forecast height, period and wind speed — it rates the waves, not whether they fit your ability.
)
3/5Worth a paddle

Sunrise around 05:35, sunset around 18:06 on Wed.

Thu’s call (
our estimate? (what does this mean?)A 1-5 score of how organised the waves look, from forecast height, period and wind speed — it rates the waves, not whether they fit your ability.
)
3/5Worth a paddle

Sunrise around 05:35, sunset around 18:06 on Thu.

Fri’s call (
our estimate? (what does this mean?)A 1-5 score of how organised the waves look, from forecast height, period and wind speed — it rates the waves, not whether they fit your ability.
)
3/5Worth a paddle

Sunrise around 05:34, sunset around 18:06 on Fri.

Sat’s call (
our estimate? (what does this mean?)A 1-5 score of how organised the waves look, from forecast height, period and wind speed — it rates the waves, not whether they fit your ability.
)
3/5Worth a paddle

Sunrise around 05:34, sunset around 18:07 on Sat.

Tide todayHigh around 04:00 (+0.7m)Low around 10:00 (+0.0m)High around 17:00 (+0.8m)Low around 23:00 (+0.2m)
nowHigh 04:00+0.7mLow 10:00+0.0mHigh 17:00+0.8mLow 23:00+0.2m
Model estimate (MeteoFrance SMOC), heights relative to
mean sea level? (what does this mean?)The long-run average height of the sea surface — tide heights are metres above (+) or below (−) that average.
, times approximate — not a tide table and not for navigation.
Tide MonHigh around 04:00 (+0.7m)Low around 11:00 (-0.0m)High around 18:00 (+0.9m)
High 04:00+0.7mLow 11:00-0.0mHigh 18:00+0.9mLow 00:00+0.2m
Model estimate (MeteoFrance SMOC), heights relative to
mean sea level? (what does this mean?)The long-run average height of the sea surface — tide heights are metres above (+) or below (−) that average.
, times approximate — not a tide table and not for navigation.
Tide TueLow around 00:00 (+0.2m)High around 05:00 (+0.6m)Low around 11:00 (-0.1m)High around 18:00 (+0.9m)
Low 00:00+0.2mHigh 05:00+0.6mLow 11:00-0.1mHigh 18:00+0.9m
Model estimate (MeteoFrance SMOC), heights relative to
mean sea level? (what does this mean?)The long-run average height of the sea surface — tide heights are metres above (+) or below (−) that average.
, times approximate — not a tide table and not for navigation.
Tide WedLow around 01:00 (+0.2m)High around 06:00 (+0.5m)Low around 12:00 (-0.1m)High around 19:00 (+0.9m)
Low 01:00+0.2mHigh 06:00+0.5mLow 12:00-0.1mHigh 19:00+0.9m
Model estimate (MeteoFrance SMOC), heights relative to
mean sea level? (what does this mean?)The long-run average height of the sea surface — tide heights are metres above (+) or below (−) that average.
, times approximate — not a tide table and not for navigation.
Tide ThuLow around 02:00 (+0.2m)High around 07:00 (+0.4m)Low around 13:00 (-0.1m)High around 20:00 (+0.9m)
Low 02:00+0.2mHigh 07:00+0.4mLow 13:00-0.1mHigh 20:00+0.9m
Model estimate (MeteoFrance SMOC), heights relative to
mean sea level? (what does this mean?)The long-run average height of the sea surface — tide heights are metres above (+) or below (−) that average.
, times approximate — not a tide table and not for navigation.
Tide FriLow around 03:00 (+0.3m)High around 07:00 (+0.4m)Low around 13:00 (+0.1m)High around 21:00 (+0.9m)
Low 03:00+0.3mHigh 07:00+0.4mLow 13:00+0.1mHigh 21:00+0.9m
Model estimate (MeteoFrance SMOC), heights relative to
mean sea level? (what does this mean?)The long-run average height of the sea surface — tide heights are metres above (+) or below (−) that average.
, times approximate — not a tide table and not for navigation.
Tide SatLow around 04:00 (+0.3m)High around 09:00 (+0.4m)Low around 15:00 (+0.1m)
Low 04:00+0.3mHigh 09:00+0.4mLow 15:00+0.1m
Model estimate (MeteoFrance SMOC), heights relative to
mean sea level? (what does this mean?)The long-run average height of the sea surface — tide heights are metres above (+) or below (−) that average.
, times approximate — not a tide table and not for navigation.

Times on this card are local to Punta Rocas. The star call is our own estimate, calculated from the forecast height, period and wind speed — not measured, and not a suitability or safety assessment. How we rate explains the scale. Weather data by Open-Meteo.com, licensed CC BY 4.0. Fetched 25 Oct 2026, 13:00.

Live conditions

14:00 (local)
Wave
1.4m
from SSW
Period? (what does this mean?)Time between waves. Longer period = more powerful, better-organised waves.
9.4s
Swell? (what does this mean?)Waves made by distant storms, smoother and more ordered than the choppy waves a local wind whips up.
1.4m
9s from SSW
Wind? (what does this mean?)Offshore wind (land to sea) holds waves up and smooths their faces; onshore wind (sea to land) makes them crumble and close out sooner.
12km/h
from SW
Estimated wave energy? (what does this mean?)How much power each metre of wave front carries (kW/m), worked out from height and period — higher numbers mean waves that push harder.
~10 kW/m(Small)

Calculated by us from the height and period above, not measured — and it describes the swell offshore, not the wave at the break.

Waves from DWD Global WAM, wind from ECMWF IFS, for a model grid point 23 km from the break. Fetched 25 Oct 2026, 13:00. Times on this card are local to Punta Rocas. Weather data by Open-Meteo.com, licensed CC BY 4.0. Not a suitability or safety assessment — check local conditions and ask your instructor.

Surf Snapshot

Estimated seasonal guidance — not a live forecast.

Oct
Consistency this monthEstimated
Moderate
Beginner safety
Risky
Crowd
Crowded
Water quality
Good
Typical size: Chest-to-double overhead (3-15 ft)
Recommended boardsShortboardstep-up
Year-round consistency
Oct: Moderate consistencyTap a month

When to surf Punta Rocas, month by month

Estimated from our authored seasonality — not a live forecast.

Peak season: Apr, May (All-time).

Month-by-month surf consistency for Punta Rocas
MonthSurf consistency
JanInconsistent
FebInconsistent
MarHigh
AprpeakAll-time
MaypeakAll-time
JunHigh
JulyHigh
AugHigh
SeptHigh
OctModerate
NovInconsistent
DecInconsistent

Does this wave fit your level?

Rated for Levels 4-7 · Best at Level 5.

Take the 2-minute quiz to see if Punta Rocas fits you today.

Find my Level →

Beginner notes

Not a beginner wave and not an improver one. It breaks over reef, its guide warns of rips and rocks, and the line-up is crowded. The Punta Hermosa camps teach on the sand beaches nearby and bring people here to watch, or to surf once they are comfortably past Level 4.

Hazards

  • rocks
  • rip currents

Nearby spots

The closest graded spots to Punta Rocas, straight-line distance.

  • Pico Alto~3 km · Level 7

Best months to surf here

In-season months for Peru, from our editors’ season calendar.

  • Apr
  • May
  • Jun
  • Jul
  • Aug
  • Sep
  • Oct

How this spot is sourced

Cross-checked against 2 sources, last checked August 2026.

Sources disagree on exact position. Treat that figure as unsettled — we would rather say so than pick one and sound certain.

  • OpenStreetMap
  • Surf-Forecast.com

On the map