

SpotsWhere to surfCampsTrip planner
Log a session
Surf Scout

Where’s the best place to surf? Skill-graded, honestly reviewed, globally indexed.

Explore
  • Camps & map
  • Best-of guides
  • Where to surf
  • Trip planner
  • Surf & work remotely
  • Surfboard airline fees
  • Board Check
  • Flying with a surfboard
  • Surf Fit Score quiz
Regions
  • Portugal
  • Morocco
  • Bali
  • Costa Rica
  • Sri Lanka
About
  • About
  • Trust & reviews policy
  • How we rate
  • Privacy
  • Analytics choice
  • Terms
  • Photo credits
  • Send feedback
© 2026 Surf Scout. Prototype build.We earn no commission on any link on this site.

Point break · right

Whisky Point

East Coast, Sri Lanka

Skill: Levels 2-4
Typical size: 2–6 ft
SpotsWhere to surfCampsTrip plannerBoard CheckQuiz
Surfed here? Log a surf
  1. Map
  2. ›
  3. Sri Lanka
  4. ›
  5. Whisky Point

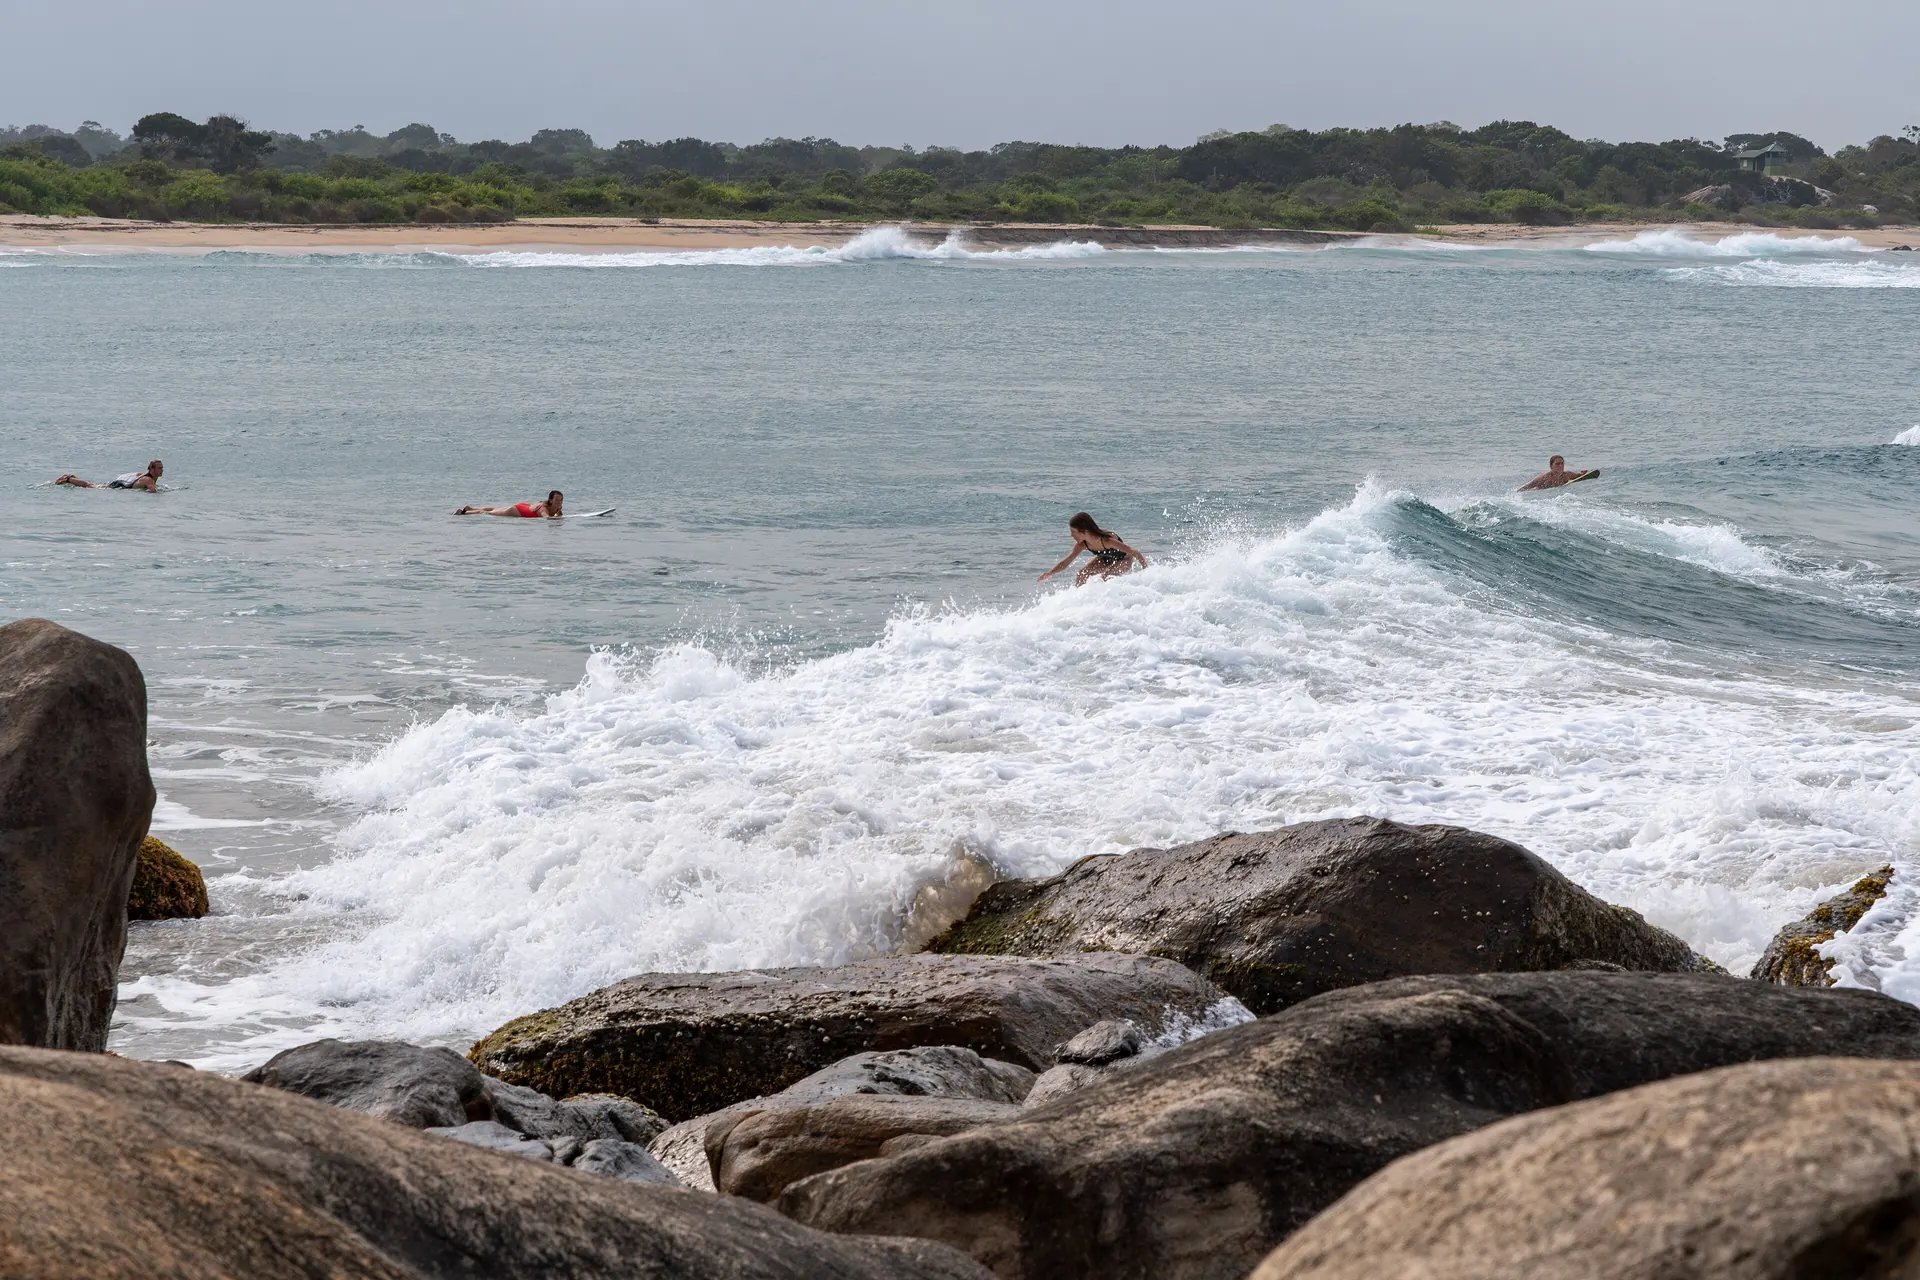
The first proper wave north of Arugam Bay town — a mellow, forgiving right that is usually the easiest of the east-coast points and a step up from flat beginner sand.

Plan a trip here →

Advanced details

The granular read for surfers who want it.

Wave type
Point break
Bottom
sand+rock
Direction
right
Best swell
S,SE
Best wind
W
Best tide
mid
Paddle
2/5
Localism
1/5
Water quality
3/5

Surf report

Live
2/5

Barely worth it

0 of 2 lined up. None of the factors we can check are in Whisky Point's favour right now — the swell is coming from the wrong angle and the tide isn't quite at its best stage.

Next fair window: 21 Nov 2026, 09:30

Live conditions

21:30 (local)
Wave
1.7m
from W
Period? (what does this mean?)Time between waves. Longer period = more powerful, better-organised waves.
8.3s
Swell? (what does this mean?)Waves made by distant storms, smoother and more ordered than the choppy waves a local wind whips up.
1.7m
8s from WSW
Wind? (what does this mean?)Offshore wind (land to sea) holds waves up and smooths their faces; onshore wind (sea to land) makes them crumble and close out sooner.
3km/h
from WNW
Estimated wave energy? (what does this mean?)How much power each metre of wave front carries (kW/m), worked out from height and period — higher numbers mean waves that push harder.
~12 kW/m(Moderate)

Calculated by us from the height and period above, not measured — and it describes the swell offshore, not the wave at the break.

Waves from DWD Global WAM, wind from ECMWF IFS, for a model grid point 20 km from the break. Fetched 16 Nov 2026, 20:30. Times on this card are local to Whisky Point. Weather data by Open-Meteo.com, licensed CC BY 4.0. Not a suitability or safety assessment — check local conditions and ask your instructor.

weak period.

Why
✗
Swell
best: S,SE
—
Wind? (what does this mean?)Wind blowing roughly along the coastline rather than from the land or the sea. Less help and less harm than a head-on offshore or onshore wind.
best: W
~
Tide? (what does this mean?)Where the sea sits in that day's own rise and fall — low, mid or high for THIS spot and THIS day, not a fixed height everywhere shares.
best: mid

Next 7 days

The best-rated window in the cached forecast.

Best day this week · Saturday (21 Nov)
3/5Worth a paddle
1.4–1.4m10s period swell from SE5km/h windfrom ENE

This is the week's best-rated wave quality, not a suitability call. Take the 2-minute quiz to see how Whisky Point fits your level.

Surf outlook

Tue’s call (
our estimate? (what does this mean?)A 1-5 score of how organised the waves look, from forecast height, period and wind speed — it rates the waves, not whether they fit your ability.
)
2/5Barely worth it

Sunrise around 05:53, sunset around 17:41 on Tue.

Wed’s call (
our estimate? (what does this mean?)A 1-5 score of how organised the waves look, from forecast height, period and wind speed — it rates the waves, not whether they fit your ability.
)
2/5Barely worth it

Sunrise around 05:53, sunset around 17:41 on Wed.

Thu’s call (
our estimate? (what does this mean?)A 1-5 score of how organised the waves look, from forecast height, period and wind speed — it rates the waves, not whether they fit your ability.
)
2/5Barely worth it

Sunrise around 05:54, sunset around 17:41 on Thu.

Fri’s call (
our estimate? (what does this mean?)A 1-5 score of how organised the waves look, from forecast height, period and wind speed — it rates the waves, not whether they fit your ability.
)
2/5Barely worth it

Sunrise around 05:54, sunset around 17:41 on Fri.

Sat’s call (
our estimate? (what does this mean?)A 1-5 score of how organised the waves look, from forecast height, period and wind speed — it rates the waves, not whether they fit your ability.
)
3/5Worth a paddle

Sunrise around 05:54, sunset around 17:41 on Sat.

Sun’s call (
our estimate? (what does this mean?)A 1-5 score of how organised the waves look, from forecast height, period and wind speed — it rates the waves, not whether they fit your ability.
)
3/5Worth a paddle

Sunrise around 05:55, sunset around 17:42 on Sun.

Mon’s call (
our estimate? (what does this mean?)A 1-5 score of how organised the waves look, from forecast height, period and wind speed — it rates the waves, not whether they fit your ability.
)
2/5Barely worth it

Sunrise around 05:55, sunset around 17:42 on Mon.

Tide TueHigh around 01:30 (+0.7m)Low around 07:30 (+0.6m)High around 14:30 (+0.7m)Low around 18:30 (+0.6m)
High 01:30+0.7mLow 07:30+0.6mHigh 14:30+0.7mLow 18:30+0.6m
Model estimate (MeteoFrance SMOC), heights relative to
mean sea level? (what does this mean?)The long-run average height of the sea surface — tide heights are metres above (+) or below (−) that average.
, times approximate — not a tide table and not for navigation.
Tide WedHigh around 01:30 (+0.7m)Low around 08:30 (+0.6m)High around 14:30 (+0.7m)Low around 18:30 (+0.6m)
High 01:30+0.7mLow 08:30+0.6mHigh 14:30+0.7mLow 18:30+0.6m
Model estimate (MeteoFrance SMOC), heights relative to
mean sea level? (what does this mean?)The long-run average height of the sea surface — tide heights are metres above (+) or below (−) that average.
, times approximate — not a tide table and not for navigation.
Tide ThuHigh around 01:30 (+0.7m)Low around 08:30 (+0.6m)High around 14:30 (+0.7m)Low around 19:30 (+0.6m)
High 01:30+0.7mLow 08:30+0.6mHigh 14:30+0.7mLow 19:30+0.6m
Model estimate (MeteoFrance SMOC), heights relative to
mean sea level? (what does this mean?)The long-run average height of the sea surface — tide heights are metres above (+) or below (−) that average.
, times approximate — not a tide table and not for navigation.
Tide FriHigh around 01:30 (+0.7m)Low around 08:30 (+0.5m)High around 14:30 (+0.7m)Low around 19:30 (+0.6m)
High 01:30+0.7mLow 08:30+0.5mHigh 14:30+0.7mLow 19:30+0.6m
Model estimate (MeteoFrance SMOC), heights relative to
mean sea level? (what does this mean?)The long-run average height of the sea surface — tide heights are metres above (+) or below (−) that average.
, times approximate — not a tide table and not for navigation.
Tide SatHigh around 01:30 (+0.7m)Low around 08:30 (+0.5m)High around 15:30 (+0.7m)Low around 20:30 (+0.6m)
High 01:30+0.7mLow 08:30+0.5mHigh 15:30+0.7mLow 20:30+0.6m
Model estimate (MeteoFrance SMOC), heights relative to
mean sea level? (what does this mean?)The long-run average height of the sea surface — tide heights are metres above (+) or below (−) that average.
, times approximate — not a tide table and not for navigation.
Tide SunHigh around 01:30 (+0.7m)Low around 09:30 (+0.4m)High around 16:30 (+0.6m)Low around 21:30 (+0.6m)
High 01:30+0.7mLow 09:30+0.4mHigh 16:30+0.6mLow 21:30+0.6m
Model estimate (MeteoFrance SMOC), heights relative to
mean sea level? (what does this mean?)The long-run average height of the sea surface — tide heights are metres above (+) or below (−) that average.
, times approximate — not a tide table and not for navigation.
Tide MonHigh around 02:30 (+0.7m)
High 02:30+0.7m
Model estimate (MeteoFrance SMOC), heights relative to
mean sea level? (what does this mean?)The long-run average height of the sea surface — tide heights are metres above (+) or below (−) that average.
, times approximate — not a tide table and not for navigation.

Times on this card are local to Whisky Point. The star call is our own estimate, calculated from the forecast height, period and wind speed — not measured, and not a suitability or safety assessment. How we rate explains the scale. Weather data by Open-Meteo.com, licensed CC BY 4.0. Fetched 16 Nov 2026, 20:30.

Surf Snapshot

Estimated seasonal guidance — not a live forecast.

Nov
Consistency this monthEstimated
Rare
Beginner safety
Safe
Crowd
Busy
Water quality
Good
Typical size: Waist-to-overhead (2-6 ft)Boardshorts
Recommended boardsFoamieLongboardMid
Year-round consistency
Nov: Rare consistencyTap a month

Quick answers about Whisky Point

Where is Whisky Point?

Whisky Point is in East Coast, Sri Lanka.

What level is Whisky Point for?

Whisky Point suits Levels 2-4 surfers.

When is surf most consistent at Whisky Point?

Our seasonality estimates put Whisky Point's most consistent surf in Jun–Sep. This is seasonal guidance, not a live forecast.

  • Peak consistency rating: All-time (on our 0-5 scale).

When to surf Whisky Point, month by month

Estimated from our authored seasonality — not a live forecast.

Peak season: Jun, July, Aug, Sept (All-time).

Month-by-month surf consistency and wetsuit guidance for Whisky Point
MonthSurf consistencyWetsuit
JanRareBoardshorts
FebRareBoardshorts
MarRareBoardshorts
AprInconsistentBoardshorts
MayHighBoardshorts
JunpeakAll-timeBoardshorts
JulypeakAll-timeBoardshorts
AugpeakAll-timeBoardshorts
SeptpeakAll-timeBoardshorts
OctModerateBoardshorts
NovRareBoardshorts
DecRareBoardshorts

Does this wave fit your level?

Rated for Levels 2-4 · Best at Level 3.

Take the 2-minute quiz to see if Whisky Point fits you today.

Find my Level →

Beginner notes

A fair first point break for a confident improver; it gets busy with lesson groups through the season.

Hazards

  • rocky take-off on bigger days
  • learner traffic from nearby schools

Nearby spots

The closest graded spots to Whisky Point, straight-line distance.

  • Pottuvil Point~2 km · Levels 3-6
  • Arugam Bay Main Point~7 km · Levels 4-6
  • Arugam Baby Point~9 km · Levels 2-4
  • Peanut Farm~14 km · Levels 2-5
  • Okanda~29 km · Levels 4-6

Best months to surf here

In-season months for Sri Lanka, from our editors’ season calendar.

  • Jan
  • Feb
  • Mar
  • Apr
  • Nov
  • Dec

On the map